
Last week we have seen a lot of reports in media about the phenomenal sea state off the west coast of Ireland. An example is The Skipper (a journal of the Irish & UK Fishing Industries) releasing an article claiming a recorded monster wave of 30 meters. RTE had a few articles, where excited surfers mention 18 meter waves. Met Eireann and the Marine Institute M6 buoy recorded a maximum individual wave height of 21.7 meters between 27 and 28 October, with significant wave height being 15.7 meters. These were the remnants of hurricane Epsilon, that brought the extreme waves to the Irish coasts. These values are phenomenal indeed.
These reports bring us to the long standing discussion on quality control of the data. Can we trust a single instrument measuring the wave height?
It is possible to use satellites to obtain the values of the significant wave height, and luckily, Sentinel-3 mission that is jointly operated by ESA and EUMETSAT passed the general area of the M6 buoy and the Aran Islands between the 27 and 28 October.
Level-2 products are freely available through the CODA (Copernicus Online Data Access) Web Service, usually 48 hours after the sensing period. And we were able to look at the significant wave height values on the days in question.
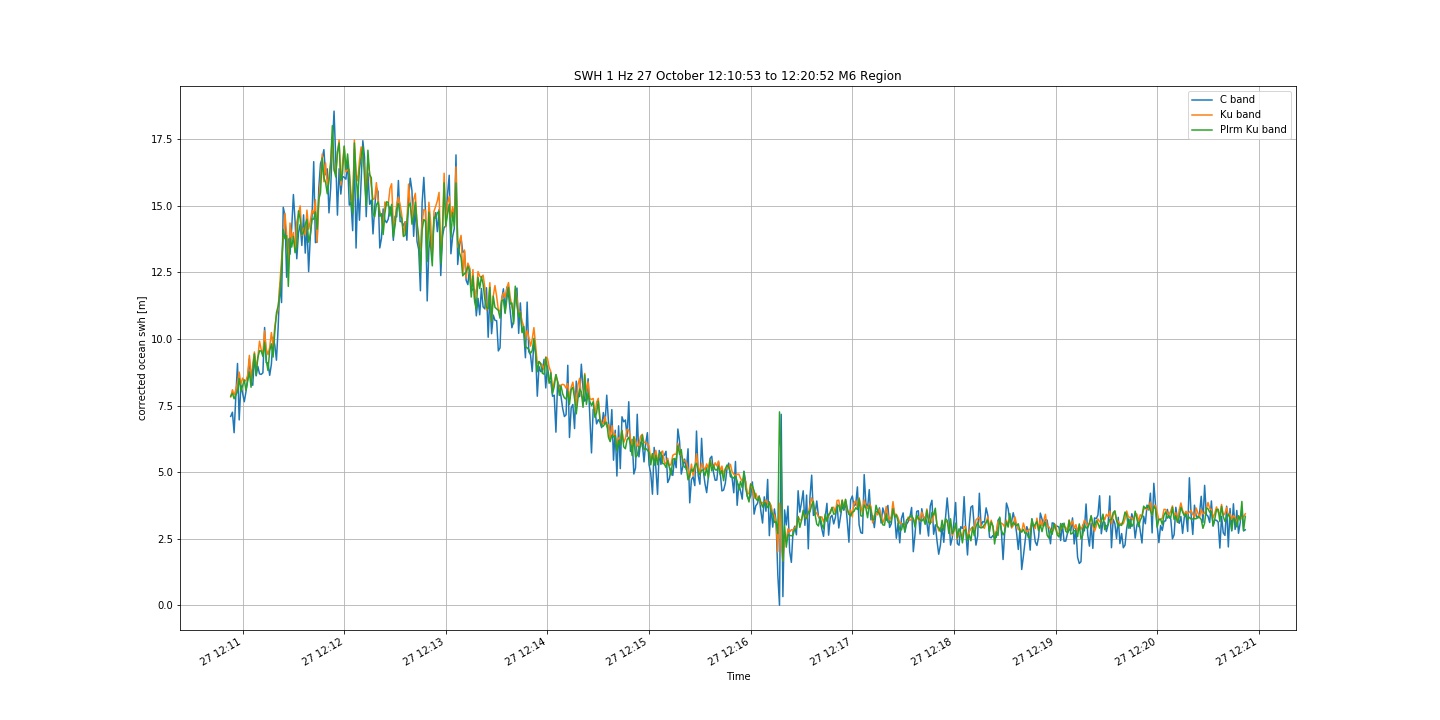
The satellite has passed the area of interest three times on 27 October 2020. The first sensing period of interest was from 12:10:53 to 12:20:52 in the general area to the west of the M6 buoy, and the measurements go over 17.5 meters for the significant wave height: Ku band measuring 17.59 meters and C band measuring 18.56 meters significant wave height. You can see the plot of the significant wave height below. We have to bear in mind that the values are not only varying in time, but the satellite is moving in space as well.
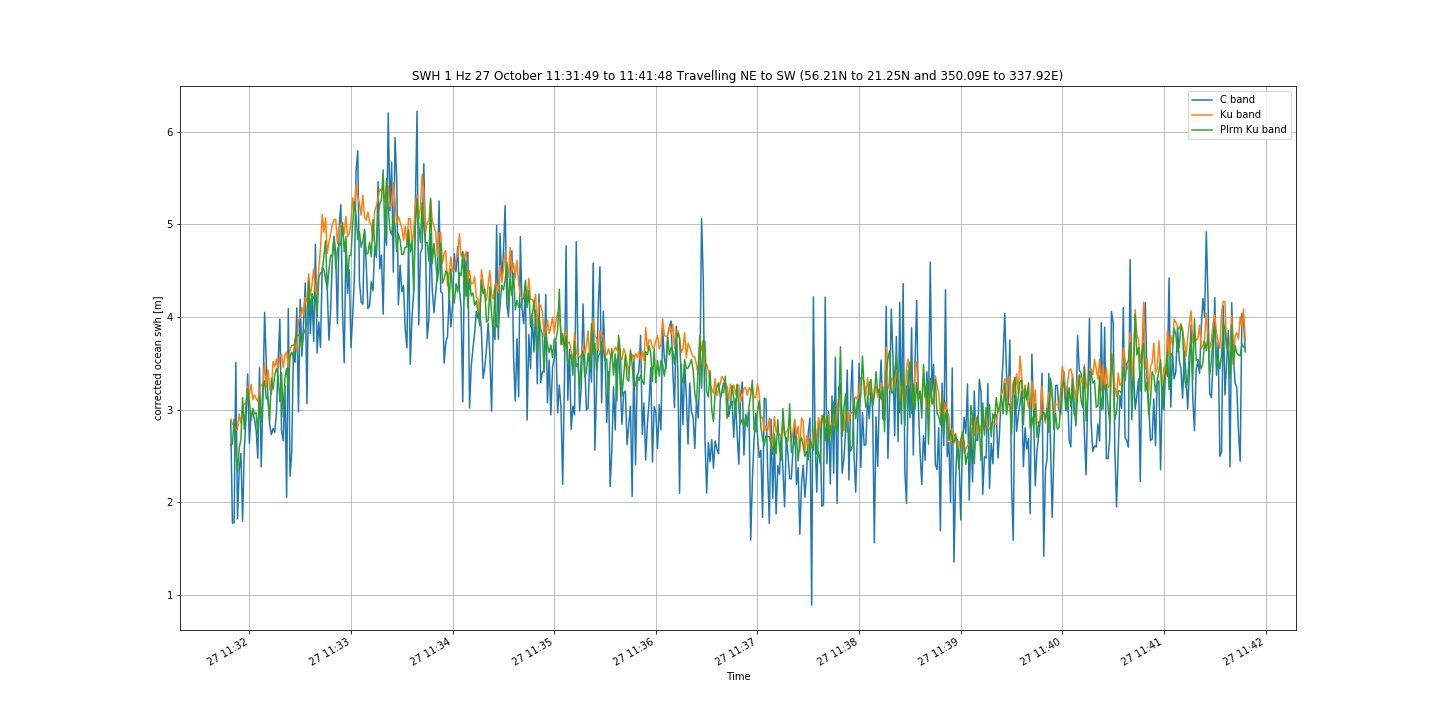
The second sensing period of interest was between 11:31:49 and 11:41:48 in the vicinity of the Aran Islands. The values recorded go slightly over 6 meters. And this was confirmed by live observations by Arnaud Disant, the project engineer, who was on the Aran Islands at the time. Same as in the above figure, we plot the evolution of significant wave height with time (as before, note that the spatial movement is not reflected in this plot).
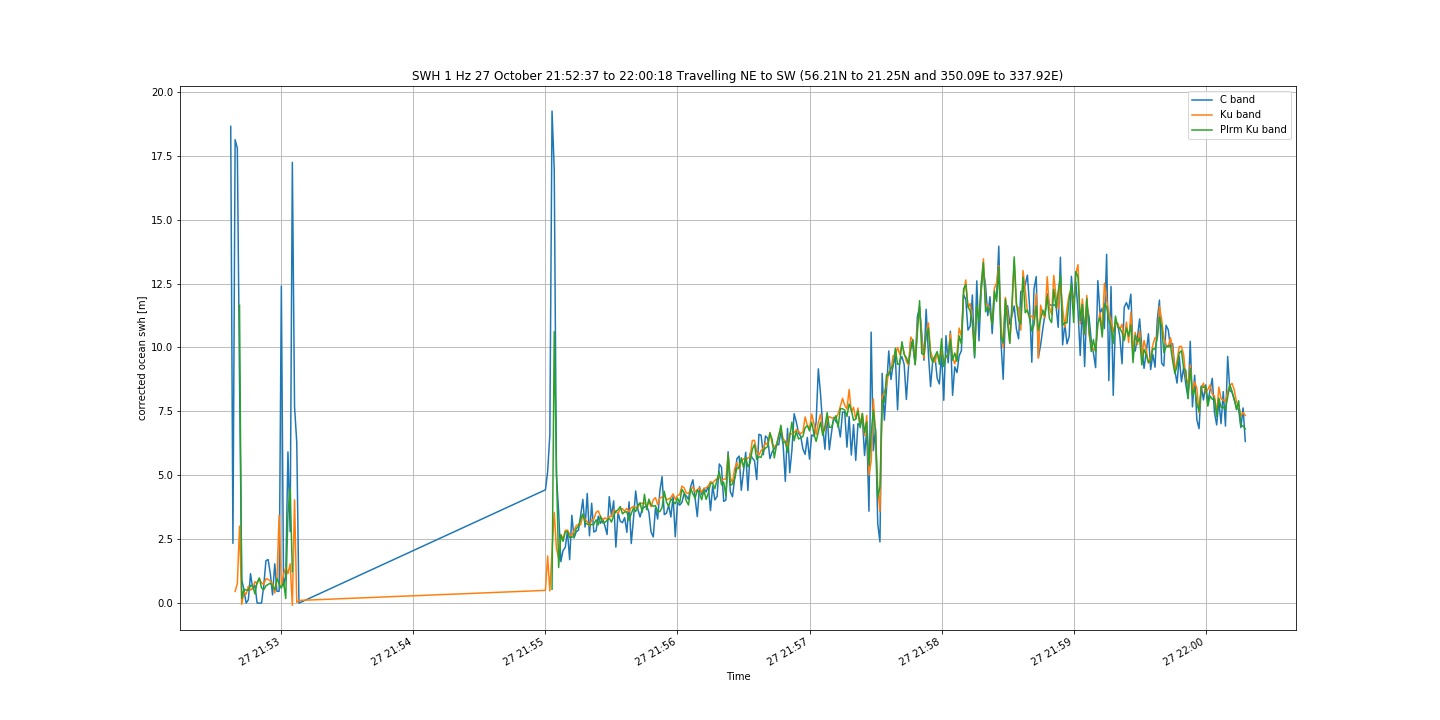
Third and last measurement on 27 October 2020 was taken between 21:52:37 and 22:00:18, in the general area of the M6 buoy. The same significant wave height vs time plot is presented below. One should note that the signal quality was 'bad' between 21:53 and 21:55:
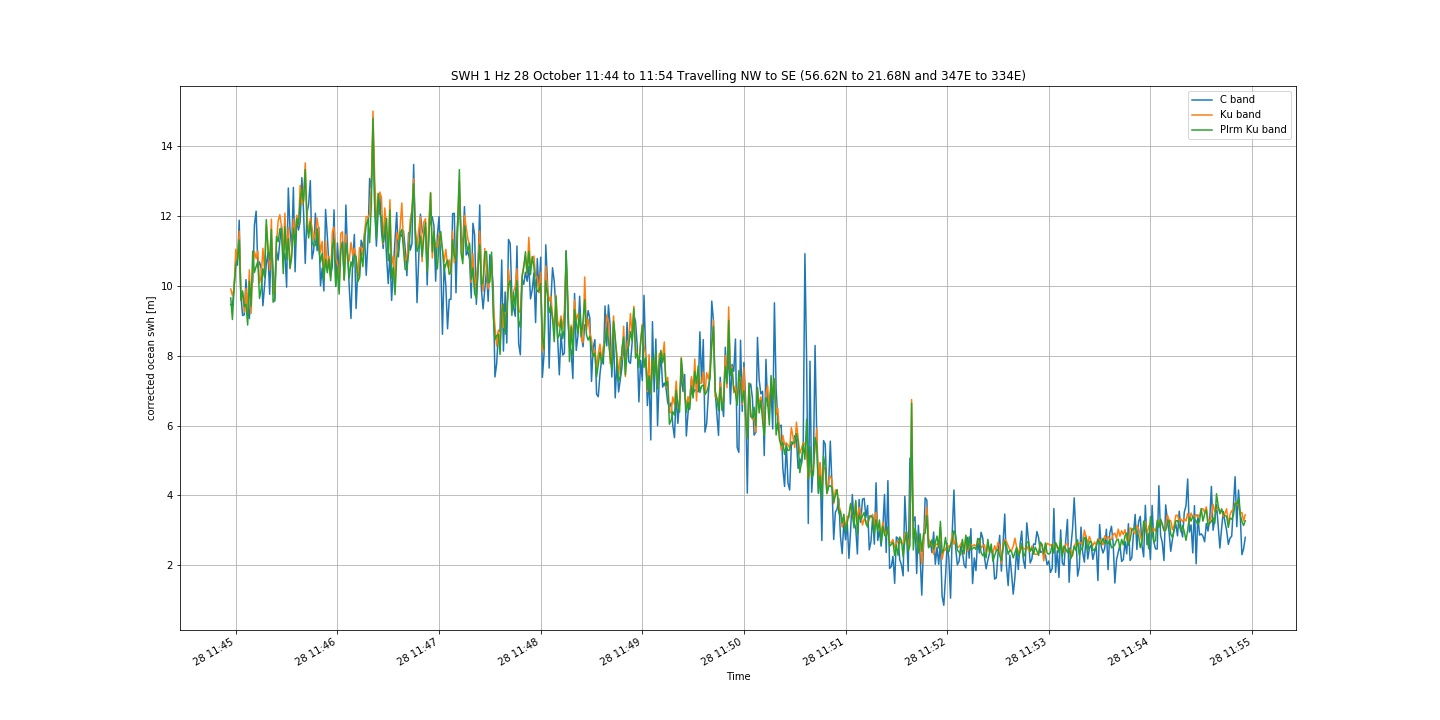
Sentinel-3 mission has again passed the general are of the M6 on 28 October 2020 between 11:44 and 11:54. A peak significant wave height over 14 meters was recorded, which can be seen in the graph below.
The values from the Sentinel-3 mission are in good agreement with the values reported by Met Eireann (https://www.met.ie/phenomenal-seas/). And it has been an interesting opportunity to compare the two for this particularly energetic event. But as mentioned earlier - one cannot rely purely on satellite - there can be periods of 'bad' signal, as seen above. This again re-emphasizes the point of having more than one instrument taking the measurement.
Unfortunately, not every extreme weather event can currently be recorded by more than one sensor. However, part of the HIGHWAVE mission is to develop new concepts in wave measurement using real-time instrumentation and we are currently working on synergy measurements, integrating the buoy measurements, stereo-video measurements, ADCP, and others. This will result in quality data that will be used to improve ocean weather forecasting models.